TYNE BUILT SHIPS
  A history of Tyne shipbuilders and the ships that they built

Home

Shipbuilders

Ships

River Views

About

Copyright


Shipbuilding output for a particular year


Select

Century

1900

1901

1902

1903

1904

1905

1906

1907

1908

1909

1910

1911

1912

1913

1914

1915

1916

1917

1918

1919

1700

1920

1921

1922

1923

1924

1925

1926

1927

1928

1929

1930

1931

1932

1933

1934

1935

1936

1937

1938

1939

1800

1940

1941

1942

1943

1944

1945

1946

1947

1948

1949

1950

1951

1952

1953

1954

1955

1956

1957

1958

1959

1900

1960

1961

1962

1963

1964

1965

1966

1967

1968

1969

1970

1971

1972

1973

1974

1975

1976

1977

1978

1979

2000

1980

1981

1982

1983

1984

1985

1986

1987

1988

1989

1990

1991

1992

1993

1994

1995

1996

1997

1998

1999

Select the required CENTURY from the left hand column. Then select the required YEAR from the matrix of years

Use the browser back arrow to return from the selected year to this century matrix

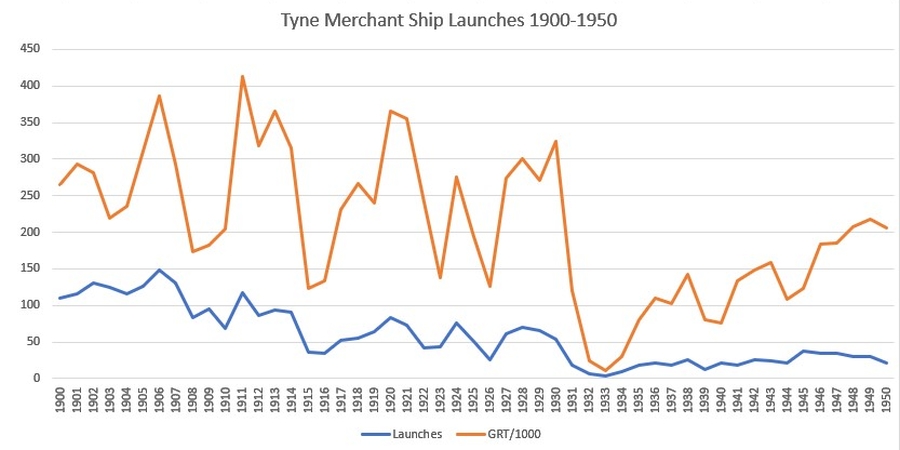
The following graphs show the number of merchant ships launched in a particular year plotted against their combined gross registered tonnage GRT divided by 1000 (GRT/100). Warships are totally excluded from this data because their GRT is either not measured or not generally known. Naval auxiliaries of all types are however included.

Above: Note the steady decline from 1906 to the slump of 1933 and the recovery to the previous trend post WW2
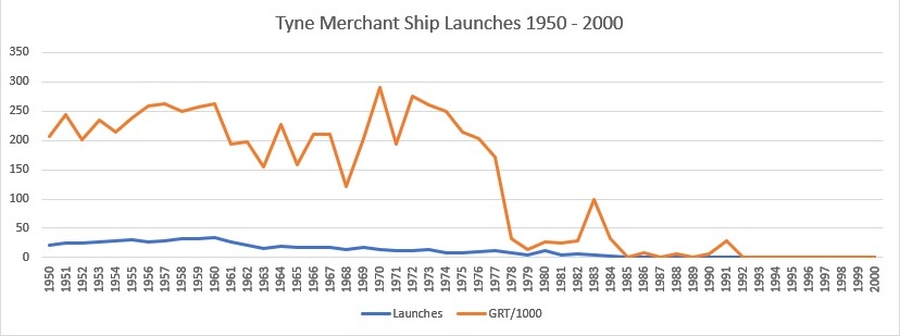
Above: Post WW2 the tonnage output is constant but launches decrease until the virtual collapse of merchant shipbuilding in 1978